Introduction
Congestive heart failure is one of the major causes of hospitalization, especially among the aging and the aged population. Despite the significant improvements in the health sector in terms of better therapeutic drugs and technologies, readmission, and mortality rates due to chronic heart failure still remains high. This ignites the need to develop a deeper understanding of the flow of blood within the cardiovascular system, generally known as cardiovascular hemodynamics, to be in a position to foster not only adaptive measures but also the implementation of preventive measures. Although heart failure might come from any part of the heart, most failures are always linked to the left heart ventricle (LV) available at the bottom of the left side of the heart (Mondritzki et al., 2018). The primary function of LV is to pump blood rich in oxygen to the other parts of the body. Failure of LV to effectively and efficiently carry out its functions limits the body's access to oxygen-rich blood, leading to fluid buildup and shortness of breath.

The Cardiac Cycle
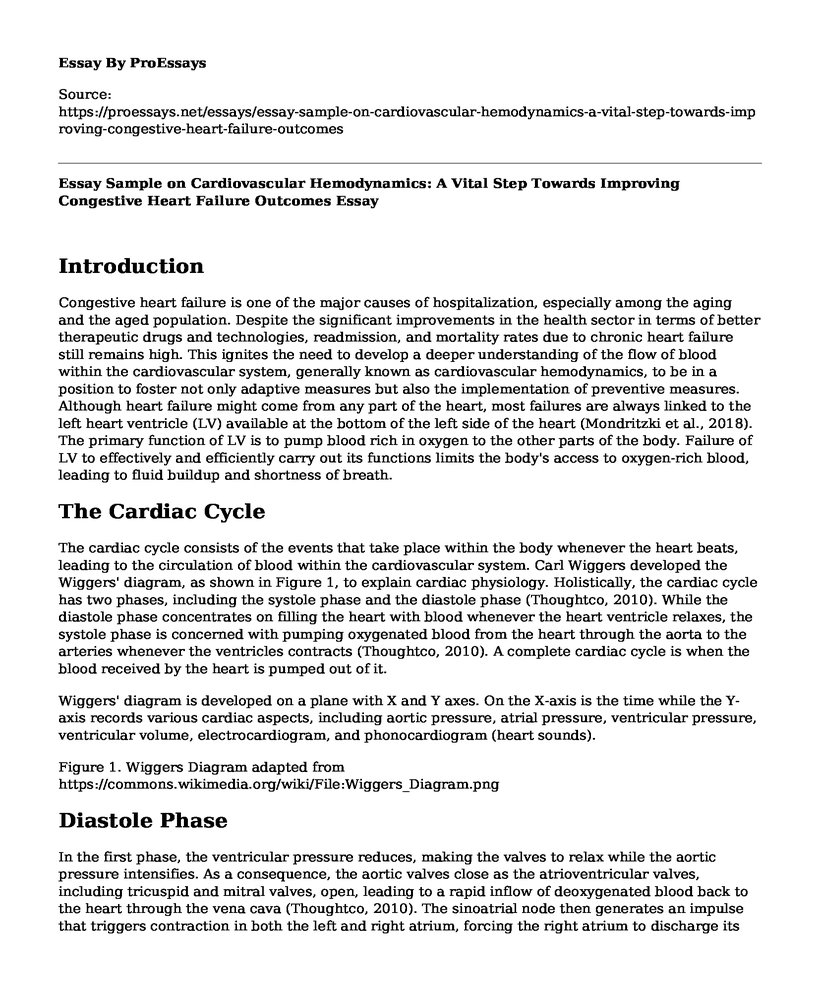
The cardiac cycle consists of the events that take place within the body whenever the heart beats, leading to the circulation of blood within the cardiovascular system. Carl Wiggers developed the Wiggers' diagram, as shown in Figure 1, to explain cardiac physiology. Holistically, the cardiac cycle has two phases, including the systole phase and the diastole phase (Thoughtco, 2010). While the diastole phase concentrates on filling the heart with blood whenever the heart ventricle relaxes, the systole phase is concerned with pumping oxygenated blood from the heart through the aorta to the arteries whenever the ventricles contracts (Thoughtco, 2010). A complete cardiac cycle is when the blood received by the heart is pumped out of it.
Wiggers' diagram is developed on a plane with X and Y axes. On the X-axis is the time while the Y-axis records various cardiac aspects, including aortic pressure, atrial pressure, ventricular pressure, ventricular volume, electrocardiogram, and phonocardiogram (heart sounds).
Figure 1. Wiggers Diagram adapted from https://commons.wikimedia.org/wiki/File:Wiggers_Diagram.png
Diastole Phase
In the first phase, the ventricular pressure reduces, making the valves to relax while the aortic pressure intensifies. As a consequence, the aortic valves close as the atrioventricular valves, including tricuspid and mitral valves, open, leading to a rapid inflow of deoxygenated blood back to the heart through the vena cava (Thoughtco, 2010). The sinoatrial node then generates an impulse that triggers contraction in both the left and right atrium, forcing the right atrium to discharge its contents to the right ventricle. The flow is controlled by the tricuspid valve between the right ventricle and atrium. During diastole, the ventricular volume expands to accommodate the rapid inflow of blood.
Systole Phase
At the beginning of the second phase, the right ventricle, having received blood from the right atrium, receives electrical impulses from fiber branches causing it to contract. At the same time, the aortic pressure starts to increase at a much higher rate than the ventricular and atrial pressure causing the semilunar and atrioventricular valves to open. (Thoughtco, 2010) The ventricular volume also contracts to cause the blood to be ejected from the right ventricle to the pulmonary artery, which carries the deoxygenated to the lungs for oxygenation. The pulmonary valve ensures that the blood does not flow back to the right ventricle. The oxygenated blood flows back to the left atrium from the lungs through the pulmonary vein.
Atrial Diastole and Systole
While the left atrium gets full of the oxygenated blood from the lungs, the right atrium simultaneously gets filled with deoxygenated blood from the vena cava. The contraction in the two atria makes the left atrium to discharge the oxygenated blood to the left ventricle and right atrium to discharge deoxygenated blood to the right ventricle. Between the left ventricle and the left atrium is the mitral valve preventing the flow-back of the oxygenated blood back to the left atrium.
Full of blood from the atria, the ventricles receive impulses that compel them to contract, forcing the oxygenated blood out of the heart through the aorta to other arteries and deoxygenated blood to the lungs through the pulmonary artery. The blood pumped through the aorta moves through the circulatory system and returns to the heart through the vena cover in a deoxygenated form.
Flows Across the MV
The mitral valve (MV) controls the flow of oxygenated blood between the left atrium and the left ventricle by ensuring that blood in the left ventricle does not flow back to the left atrium during the atrial systole. With the closure of the aortic valve, the ventricles relax, causing a reduction in the ventricular pressure while the volume of the ventricles remains the same in a process known as isovolumetric relaxation. The imbalance of pressure between the left ventricle and the left atrium causes the MV to open, leading to the rapid filling of the LV in the early phase. About 75% of the blood in the LV is attributed to the early rapid filling phase, which ends when left atrial (LA) pressure equalizes LA pressure, otherwise known as diastasis (Mondritzki et al., 2018). The remaining blood percentage in the LV is attributable to atrial contraction, which occurs during atrial systole, creating a pressure gradient between LA and LV. Echocardiography is one of the major tools used in evaluating the cardiac function and is attained through two -dimensional (2D) imaging, M-mode imaging, or Doppler imaging.
In the normal blood flows from LA to LV, the MV opens during the ventricular diastole allowing the flow towards the same direction.
Mechanical obstructions during the flow of blood from the left atrium and left ventricle result in mistral stenosis, also known as mitral valve stenosis. Such obstructing causes the MV to narrow, making it difficult for the valve to open properly, limiting the pumping of blood to the LV (Mayo Clinic, 2017). Mistral stenosis is primarily caused by rheumatic fever, as well as thicker and immobile heart walls. The normal mitral valve area (MVA) is 4-6 cm2. Any MVA below 2cm2 amounts in difficulty in the flow of blood by increasing the pressure gradient across the MV (Mondritzki et al., 2018). When the MVA gets to 1cm2 or below, the left atrial pressure increases, leading to pulmonary hypertension and other severe conditions such as edema and pulmonary congestion.
Pressure Half Time (PHT) is one of the approaches used to calculate the MVA. The MVA is calculated as follows:
MVA = 220/PHT.
To obtain PHT, trace how the E-wave on the Doppler spectral display slopes. It can also be determined through:
MVA = (CSALVOT x VTILVOT)/VTIMV
The following table summarizes the mitral stenosis severity values
Mitral Valve PHT MVA Mean Pressure Gradient
Normal 30-60Msec 4.0-5.0 cm2 Mild 90-150Msec >1.5 cm2 5mmHg
Moderate 150-219Msec 1.0-1.5 cm2 7-10mmHg
Severe >220 Msec 1 cm2 10mmHg
Figure 2. Mitral stenosis severity values
2D-imaging echocardiography is used to assess changes in the thickness and the shortness of the calcification. As the leaflet edges thicken, the ventricular systolic functions in the LV decreases, causing the LA to dilate.
Regurgitant flows occur when the blood in the left ventricle flows back to the left atrium through a malfunction mistral valve. People with mitral regurgitation are likely to exhibit shortness of breath, fatigue, swollen legs, dizziness, and chest pain, amongst others. The condition is caused by factors such as mistral annular dilation, endocarditis, and imbalance in the MV pressure (Mayo Clinic, 2017). The figures below high-density regurgitation signal and how to estimate the pulmonary artery systolic pressure.
Flows Across the AoV
The aortic valve has three thin tissues, which are leaflets in nature. These tissues regulate blood flow by opening and closing in normal blood flow within the aortic valve. However, sometimes they become stiff, thereby causing narrowing of the aortic valve orifice, a condition called aortic stenosis. Birth defects in which an individual is born with two thin leaflets instead of three within their aortic valve and rheumatic fever are some of the causes of aortic stenosis. Aortic stenosis causes the heart to work extra hard to pump oxygen-rich blood to the rest of the body, which limits its ability to pump enough blood (Morud et al., 2019).
The volume flow close to the valve equals the volume flow through the narrowed orifice, which is the applicable principle that governs the calculation of aortic valve area (AVA). At the same time, the volume flow is obtained as the cross-sectional area (CSA) of flow multiplied by the velocity-time integral (VTI) flow at that site.
Aortic regurgitation is a condition in which blood flows backward or across the aortic valve across the aorta to the left ventricle during the relaxation of the heart after contracting. Aortic regurgitation causes several pathological changes to compensate for the resulting decrease in cardiac output. The primary causes of this condition are dilation of the aortic annulus and damage to the aortic valve leaflets (Ngiam et al., 2019). Echocardiography is the primary tool used in diagnosing aortic regurgitation as it can characterize the cardiac size and the degree of regurgitation.
Three parameters in echocardiography are utilized in evaluating the severity of aortic regurgitation. These include regurgitant jet size, regurgitant fraction, and pressure half-time. Regurgitant jet size represents the ratio of the aortic regurgitation jet diameter just below the leaflets of the aortic valve to the size of the LV outflow diameter. In an ideal condition, the ratio should be zero. However, when it is below 24, it is considered as mild, and when it is between 25 and 45 it is considered as moderate, and when it is between 45 and 45 it is considered as moderately severe and above 65 is considered as severe (Ngiam et al., 2019). Pressure half-time index is the time that initial maximal pressure in diastole takes to fall by 50%. A pressure half-time of more than 500 milliseconds (ms) is considered as mild aortic regurgitation, between 500 ms to 349 ms is moderate, from 349 ms to 200 ms is moderately severe, and less than 200 ms is severe. The regurgitant fraction is the percentage of stroke volume that returns to the left ventricle from the aorta during the relaxation of the heart after contraction. A regurgitant fraction of less than 20% indicates mild aortic regurgitation, while from 20% to 35% indicates moderate aortic regurgitation. Additionally, from 36% to 50% indicate moderately severe aortic regurgitation, and more than 50% indicates severe.
Cite this page
Essay Sample on Cardiovascular Hemodynamics: A Vital Step Towards Improving Congestive Heart Failure Outcomes. (2023, Apr 08). Retrieved from https://proessays.net/essays/essay-sample-on-cardiovascular-hemodynamics-a-vital-step-towards-improving-congestive-heart-failure-outcomes

so we do not vouch for their quality

If you are the original author of this essay and no longer wish to have it published on the ProEssays website, please click below to request its removal:
- Critikal Thinking on Bananas Injected with HIV-Infected Blood
- Palliative Sedation Essay Example
- Essay Example on Medicare: Caring for America's Elderly for 50+ Years
- Abortion: A Global Health Crisis With Severe Consequences - Essay Sample
- Paper Example on Public Healthcare: The Cornerstone of a Balanced Health System
- 'Nursing Profession: Professional Ethics and Guiding Theories' - Essay Sample
- Health: Maintaining a Healthy Lifestyle - Essay Example


