Fitbit Inc. is a top global brand in the wearable brands. The company reported an income of $571million in the 2017 last quarter and during the same year, it reported $0.02 non-GAAP net loss per share and $0.19 GAAP net loss per share in 4th Quarter 2017. Additionally, during the same period, it also reported a $5 million net loss, a $52 million operations cash flow, and a $25 million free cash flow. In total, for the entire year, 2017, Fitbit reported a $1.6 billion revenue, $1.19 GAAP net loss per share, $0.26 non-GAAP net loss per share, and $277 million GAAP net loss (Fitbit Investor Report, 2017). The non-GAAP net loss was $61 million for the period and a $25 million free cash flow.

The company made a very significant and important improvement during the 2017 financial year even as it experienced very challenging market conditions. It delivered its full-year guide and minimized its operating expenses while putting more investment in innovation. With the launch of the Fitbit product, the company scaled on its future smartwatches to give a better experience to its users. Despite the investments and launch of new products, 2017 has not been a great year compared to the previous years which has seen Fitbit getting lower revenues. In 2017 alone, the company obtained a $1.6billion revenue compared to the previous year 2.2billion (Fitbit Investor Report, 2017). Furthermore, due to low revenues in 2017, Fitbit also experienced higher losses which totaled to $277million in comparison with the previous years such as 2016 which had a net loss of $103 million. Thus, in 2017, Fitbit experienced a negative EBIT compared to the positive EBIT the previous year.
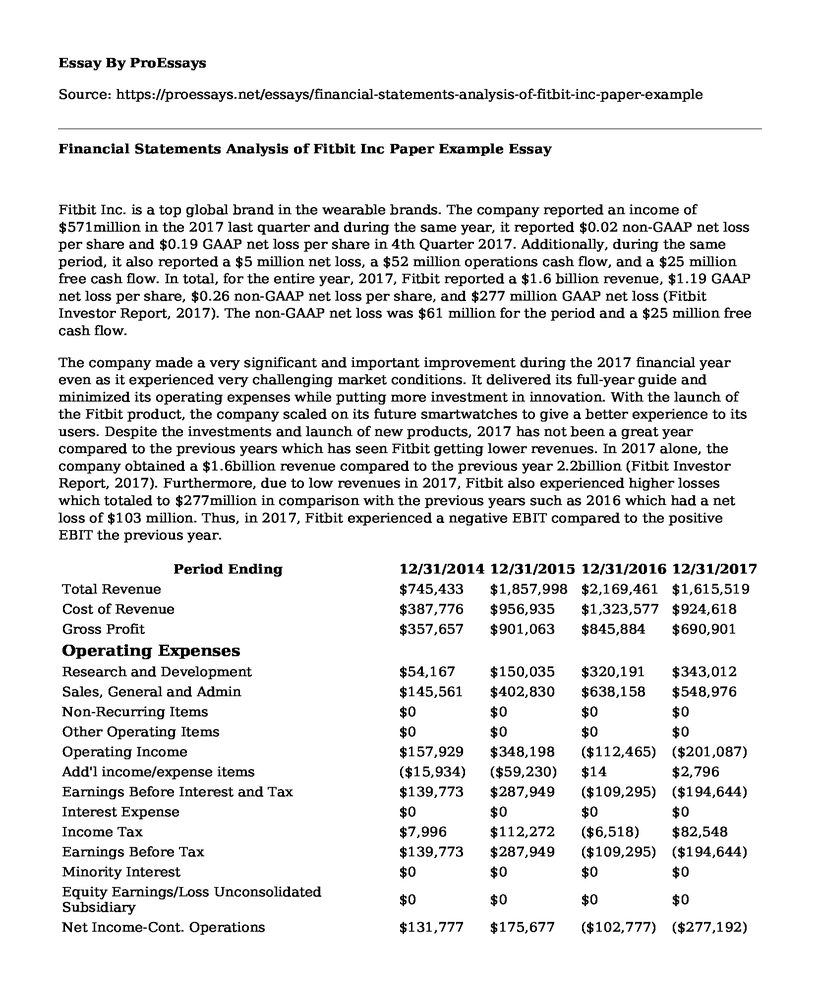
| Period Ending | 12/31/2014 | 12/31/2015 | 12/31/2016 | 12/31/2017 |
| Total Revenue | $745,433 | $1,857,998 | $2,169,461 | $1,615,519 |
| Cost of Revenue | $387,776 | $956,935 | $1,323,577 | $924,618 |
| Gross Profit | $357,657 | $901,063 | $845,884 | $690,901 |
Operating Expenses | ||||
| Research and Development | $54,167 | $150,035 | $320,191 | $343,012 |
| Sales, General and Admin | $145,561 | $402,830 | $638,158 | $548,976 |
| Non-Recurring Items | $0 | $0 | $0 | $0 |
| Other Operating Items | $0 | $0 | $0 | $0 |
| Operating Income | $157,929 | $348,198 | ($112,465) | ($201,087) |
| Add'l income/expense items | ($15,934) | ($59,230) | $14 | $2,796 |
| Earnings Before Interest and Tax | $139,773 | $287,949 | ($109,295) | ($194,644) |
| Interest Expense | $0 | $0 | $0 | $0 |
| Income Tax | $7,996 | $112,272 | ($6,518) | $82,548 |
| Earnings Before Tax | $139,773 | $287,949 | ($109,295) | ($194,644) |
| Minority Interest | $0 | $0 | $0 | $0 |
| Equity Earnings/Loss Unconsolidated Subsidiary | $0 | $0 | $0 | $0 |
| Net Income-Cont. Operations | $131,777 | $175,677 | ($102,777) | ($277,192) |
| Net Income | $131,777 | $175,677 | ($102,777) | ($277,192) |
| Net Income Applicable to Common Shareholders | $38,523 | $122,839 | ($102,777) | ($277,192) |
Financial Ratios
Profit Margins for Fitbit Company is in good standings. The profit margin is higher than the industry average. Profit margin helps the investors in determining the correct profit position of a firm. Fitbit Company has had a 17% profit margin, which is relatively high, showing that it is profitable. This percentage is great given that it is above the industry rate of profitability.
Fitbit Company ROA is also high since it is above the industry average of 9%. Return of Assets, abbreviated as ROA, in a measure of how profitable a firm is in regards to its total assets. ROA provides an idea as to how efficient the company management uses its assets to create profits. The Fitbit Company ROA is 25% for the year 2017 (Fitbit Investor Report, 2017).
Fitbit Company receivable turnover ratio is 12: 1. It is below the industry average of 16: 1. Receivable turnover shows the value of revenue of a company or the sales generated in regards to its assets. Fitbit Company and Company's receivable turnover is below industry average, and this implies that it is not generating enough revenue using the available assets.
Fitbit Company inventory turnover is 4.15 times (Fitbit Investor Report, 2017). This is below the industry average of 10 times. Again, this is not fair. The inventory turnover ratio shows the number of times a company's inventories are sold and replaced over a specific period of time. This implies that the Fitbit Company inventory turns 4.15 times every year. The turnover is very critical for the company in that it helps the company makes critical decisions regarding the purchase of inventory, and stocks, etc.
The Fitbit Company Fixed Asset is high. Fitbit Company has Fixed Asset Turnover higher than the industry ratio. This indicates that the company is using its fixed assets properly in generating sales.
This measures the ability of company assets to bring sales. Fitbit Company's total asset turnover ratio is low. It is below the industry average, and this is not good. The company uses its assets at a very low rate to generate sales.
Fitbit Company has a current ratio of 197%. It is higher than the industry average current ratio of 2: 1. Current ratios are an indicator of the levels of liquidity of a company. Current ratios also show the levels of operating cycle and company efficiency or the company's ability to monetize its services and products (Fitbit Investor Report, 2017). The higher the current ratio, the better for the company since it indicates the company's ability to settle its obligations.
Fitbit Company has a quick ratio of 180%, which is higher than the quick industry ratio of 1.5: 1. The Fitbit Company quick ratio is low. The quick ratio is important because it helps a company determine its ability to pay its short-run obligations using the short-run assets.
| Period Ending | 12/31/2014 | 12/31/2015 | 12/31/2016 | 12/31/2017 |
Liquidity Ratios | ||||
| Current Ratio | 122% | 267% | 196% | 197% |
| Quick Ratio | 97% | 232% | 165% | 180% |
| Cash Ratio | 42% | 131% | 93% | 97% |
Profitability Ratios | ||||
| Gross Margin | 48% | 48% | 39% | 43% |
| Operating Margin | 21% | 19% | 5% | 12% |
| Pre-Tax Margin | 19% | 15% | 5% | 12% |
| Profit Margin | 18% | 9% | 5% | 17% |
| Pre-Tax ROE | 186% | 29% | 11% | 24% |
| After Tax ROE | 175% | 18% | 10% | 34% |
Recommendation
Fitbit Company experienced an increase in the levels of sales from the previous year. It experienced an increased profit ratio from the previous year. The company also experienced positive profitability ratios and the gross margins; an operating margin was relatively high. Good profitability ratios are an indicator that the company is do9ng well financially and will give dividends to the investors. The current ratios and quick ratios were also positive. These two ratios show the liquidity levels of the company and its ability to cater for its urgent needs for cash. The company is in a position to give dividend and returns to the shareholders. The ROA and ROE also indicate that Fitbit is in a position to use its assets effectively to yield some returns.
Given the above analysis, I would be more comfortable to invest in the Fitbit Company. This is because an investor could choose to put his or her money in the company since the financial analysis indicates a firm that is properly managed and promising sustainable returns. The company has increased value in its share over the period. Therefore, investors often prefer investing in companies that are internally secure which would be the primary reason for choosing the Fitbit Company.
References
Fitbit Investor Report (2017). Press Release. Accessed online
https://investor.fitbit.com/press/press-releases/press-release-details/2018/Fitbit-Reports-571M-Q417-and-1616B-FY17-Revenue/default.aspx [20th July 2018]
Cite this page
Financial Statements Analysis of Fitbit Inc Paper Example. (2022, Jul 05). Retrieved from https://proessays.net/essays/financial-statements-analysis-of-fitbit-inc-paper-example

so we do not vouch for their quality

If you are the original author of this essay and no longer wish to have it published on the ProEssays website, please click below to request its removal:
- The SSI Federal Income Program - Paper Example
- Evaluation Essay on Royal National Park
- Liquidity, Profitability and Solvency Analysis Paper Example
- Type of PICOT and Rationale for Choice of this Type of PICOT
- Essay Example on Maximizing Profits in DNA Capsim: Prod, Res, Mktg & Fin Decisions
- Data Collection Techniques: A Case Study
- Paper Example on CDC's ADHD Info: A Rhetorical Analysis


