RESULTS AND ANALYSIS
Table 1

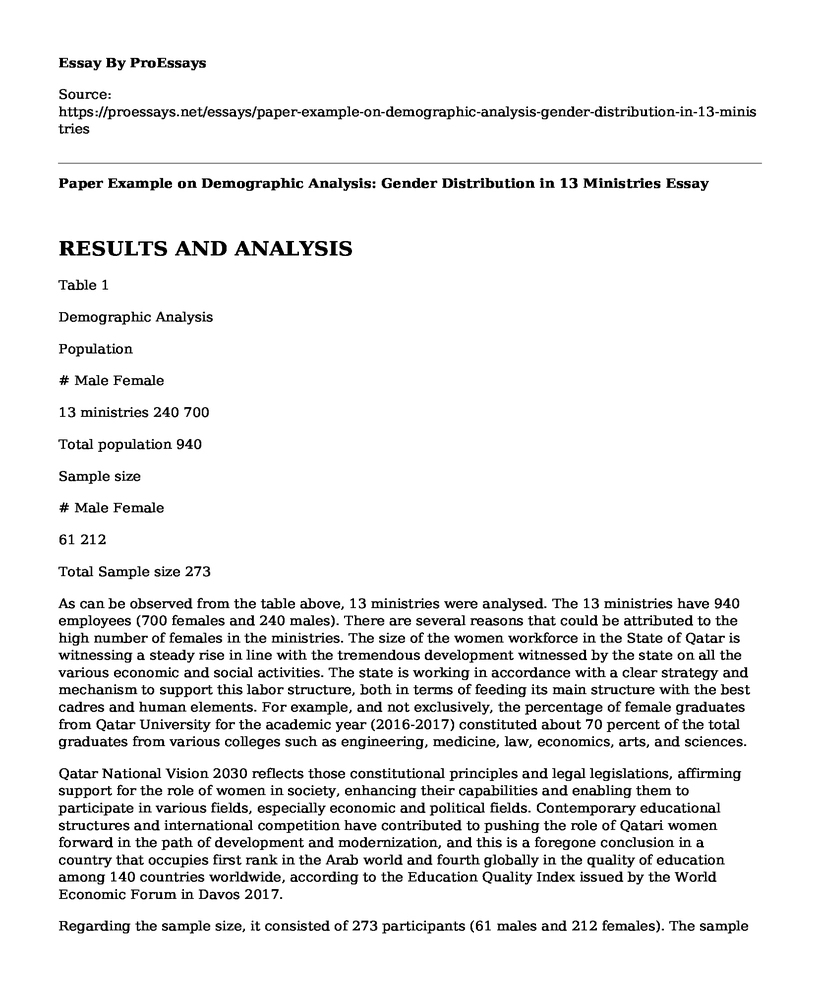
Demographic Analysis
Population
# Male Female
13 ministries 240 700
Total population 940
Sample size
# Male Female
61 212
Total Sample size 273
As can be observed from the table above, 13 ministries were analysed. The 13 ministries have 940 employees (700 females and 240 males). There are several reasons that could be attributed to the high number of females in the ministries. The size of the women workforce in the State of Qatar is witnessing a steady rise in line with the tremendous development witnessed by the state on all the various economic and social activities. The state is working in accordance with a clear strategy and mechanism to support this labor structure, both in terms of feeding its main structure with the best cadres and human elements. For example, and not exclusively, the percentage of female graduates from Qatar University for the academic year (2016-2017) constituted about 70 percent of the total graduates from various colleges such as engineering, medicine, law, economics, arts, and sciences.
Qatar National Vision 2030 reflects those constitutional principles and legal legislations, affirming support for the role of women in society, enhancing their capabilities and enabling them to participate in various fields, especially economic and political fields. Contemporary educational structures and international competition have contributed to pushing the role of Qatari women forward in the path of development and modernization, and this is a foregone conclusion in a country that occupies first rank in the Arab world and fourth globally in the quality of education among 140 countries worldwide, according to the Education Quality Index issued by the World Economic Forum in Davos 2017.
Regarding the sample size, it consisted of 273 participants (61 males and 212 females). The sample is the part or subset of a population that represents its characteristics (Barreiro & Albandoz, 2001). The sampling process is basic to make inferences to the population from the sample with which the study was conducted A sample is representative of the subset of elements that compose it compare the characteristics of the population to which they intend to generalize their results. According to Buendia (1998), a sufficient sample is the one made up of 30 elements (or more), although this does not guarantee that the sample will be representative of the population (if the population to be investigated is very heterogeneous or the study characteristic has little presence in the population, it will be necessary to increase or decrease this "sufficient" size). The sample consisted of 273 employees from the 13 different ministries. The sample size is therefore sufficient enough since it is made up of more than 30 elements.
From the sample, it can be observed that the number of women is also greater than that of men. This can be attributed to the fact that the population of women was still higher compared to men even in the original population.
Table 2
Response Rates
Descriptions Frequency Percentage (%) Non response Percentage (%)
Gender Male 50 18% 11 4%
Female 185 68% 27 10%
Total 235
Age 18-25 123 52%
26-35 32 14%
36-45 30 13%
46-55 25 11%
56-65 25 11%
Total 235
Employment with the Organisation 1-3 Years 100 43%
3-5 Years 87 37%
6-10 Years 20 9%
Over 10 Years 28 12%
Involvement in Hyperion Implementation project Full Involvement 207 88%
Partial Involvement 28 12%
Position in Organisation Top management 10 4%
Middle level management 36 15%
Lower level management 53 23%
Employee 136 58%
Size of the Organisation Under 100 employees 0 0%
101-500 employees 6 46%
Above 500 employees 7 54%
Education High school 47 20%
BS degree 153 65%
Master degree 23 10%
Ph.D. Degree 12 5%
Gender response rate
As can be observed in table 1, the total sample size was 273. However, not all of them accepted to participate in the interview process. 11 men and 27 women refused, thus taking the total to 235 (participants who accepted to partake in the surveys). There are several reasons why the 38 participants refused to partake in the survey. Many times people refuse to fill out a survey because they consider this a waste of time, and rather boring. Other reasons why people may refuse to participate in surveys include poorly worded surveys, spelling and grammar errors, many open questions, a long questionnaire, and alternatives that do not answer the questions. The wording of the questions can be ambiguous or blunt. Many technical terms may be unknown to the user. Clarity, objectivity and a good sentence structure may be lacking. Spelling errors, grammar and even simple typing errors can decrease the credibility of a questionnaire. A questionnaire with many mandatory open-ended questions can also discourage users.
Age analysis
Most of the respondents are between the ages of 18-25 (52%), followed by 26-35 (14%), then 36-45 years (13%). The least responses were from those between the age brackets of 46-55 and 56-65. There are several reasons why most of the respondents are young people. Access to university has enabled Qatar millennials to become the most qualified generation of young people to date, in fact, many of them have expanded their university education with online courses and masters. Besides, as they have grown and been trained with digital tools, they are able to solve problems by searching for solutions online. Another advantage of hiring young people is that this generation does not base their personal motivation on their payroll. There are other cheaper ways (equal but rewarding) to reward the millennials, such as flexible hours, staff recognition of their peers or a promotion plan. These are some of the reasons why most of the respondents comprise of a young workforce.
Employment with the organisation
Regarding the number of years worked in the organisation, most of the respondents have worked in their organisations for 1-3 years (100 respondents-43%), followed by 3-5 years (87 respondents-37%), then 6-10 years (20 respondents-9%). The least number of respondents are those who have worked for over 10 years (28 respondents-12%). The reason for this is that most of the respondents have worked for a short time because they have just graduated from the university and are most qualified.
Involvement in Hyperion Implementation project
The findings regarding the involvement in Hyperion implementation project shows that most participants are full involvement (207 representing 88%) while those who are partially involved are 28 (representing 12%). There are several reasons why most employees prefer being employed on a full time basis. In general, growth expectations within a company tend to be among full-time workers; it is very rare that this occurs among those who are part-time. The only possibility is perhaps to gain more experience through this type of work to get an indefinite position within the company. Moreover, the part-time modality means that the worker does not fully know the company or the business, with its culture, procedures, processes and industry, which can be a point of disadvantage to generate more assertive responses and decisions. On the other hand, this type of modality does not allow the employer to have free access to the availability of time for the person performing the task, which could hinder the ease of response times and access to information as opposed to a fully employed person.
Position in organisation
Regarding the position in organisation, most of the participants were employees (136-58%), then lower level management employees (53-23%), followed by middle level management employees (36-15%) and lastly top management employees (10-4%). This could be attributed to the fact that most of the employees are young and are most likely to be employees, as year's progress, they move to the middle level management and finally the top management.
Size of the organisation
Regarding the size of the organisation, most employees work in companies with more than 500 employees (7-54%) and secondly those who work in companies with 101-500 employees (6-7%). Most of the organisations chosen were large in size because they conduct financial performance analysis and this would help in achieving the research objectives of establishing the role and importance of financial performance analysis in government administration.
Education
Regarding education levels, most of the respondents had degrees (153-65%), then high school level (47-20%), followed by those with a master degree (23-10%) and lastly PhD holders (12-5%). There are several reasons why this is the case. First, most of the respondents were between the ages of 18-25 and at that age, most only have bachelor degrees. Undergraduate course remains the maximum reference to certify the knowledge of a professional in a certain area. After all, this type of training has unique characteristics that make all the difference when it comes to training to exercise a profession and, later, to stand out in the midst of competition.
Reliability Test
In recent years, internal consistency methods have become relevant, thus preparing different coefficients such as: Cronbach's alpha, Omega, Armor's Theta and H-coefficient. The choice of the reliability coefficient is subject to the characteristics of the data to be analysed (Bonett & Wright, 2015). However, it is common to use Cronbach's alpha, which surely the tests reported in the article show this reliability estimator. In this sense, reliability and validity are important properties of being reported because it allows the reader to know the level of precision and evidence of the instruments used, which will lead to consistent conclusions in the study.
Reliability means consistency, accuracy and precision in measurement. Its importance lies in the fact that in order to consider the tests as adequate and scientific, reliability must be an essential requirement (Bonett & Wright, 2015). The objectivity of a test is determined by the degree to which it meets the requirements of reliability and validity, which allows it to be a scientific resource. Reliability in the broad sense is the accuracy, the precision with which a measuring instrument measures the object. Reliability would be the absence of measurement errors using a certain instrument. Reliability denotes the true variance ratio and is linked to measurement error, therefore, the greater the reliability, the smaller the measurement error.
Oveisgharan et al. (2006) stated that the acceptable alpha value in reliability analysis should be 0.8 while the acceptable alpha value for ability tests should be 0.7. Conventionally, an alpha of 0.8 in reliability tests is considered more acceptable, the higher the value, the better and a higher value is preferred. A value below 0.60 is considered unacceptable, a value between 0.60 and 0.65 is considered undesirable, a value between 0.65 and 0.70 is considered minimally acceptable, a value between 0.70 and 0.80 is considered respectable, a value between 0.80 and 0.90 is considered very good and if the value is above 0.90, shortening the scale should be considered.
Alpha values between 0.93 and 0.96 is considered excellent, values between 0.91 and 0.93 is considered strong, while a value between 0.84 and 0.90 is considered reliable.
Table 3
Reliability test results
Variable Cronbach's Alpha
Top ma...
Cite this page
Paper Example on Demographic Analysis: Gender Distribution in 13 Ministries. (2023, May 21). Retrieved from https://proessays.net/essays/paper-example-on-demographic-analysis-gender-distribution-in-13-ministries

so we do not vouch for their quality

If you are the original author of this essay and no longer wish to have it published on the ProEssays website, please click below to request its removal:
- Indeed.com Job Announcement Requirements Paper Example
- Whole Foods' Social Mission Essay Example
- Paper Example on TechFite: Promoting Leadership & Community Involvement
- Making Criminology Career Essay
- Employee Turnover: Causes, Impact and Retention Strategies - Essay Sample
- Free Paper Sample: Impact of Employee Engagement on Organizational Development & Public Value
- Feedback: Reasons, Forms, and Benefits for Performance Improvement - Paper Sample


