The US and the Chinese economies are the largest and second largest in the world. The US Dollar is the most widely used currency in international transaction. Most exchange rates are expressed in terms of the US Dollar. The Chinese Yuan (renminbi) has become popular since the International Monetary Fund approved at to its basket of reserve currencies in 2015 (Mayeda, 2015). It joined the US Dollar, Japanese Yen, Euro and the British Pound. Its weighting of 10.92% implies that it tops the Japanese Yen and the British Pound (Mayeda, 2015).

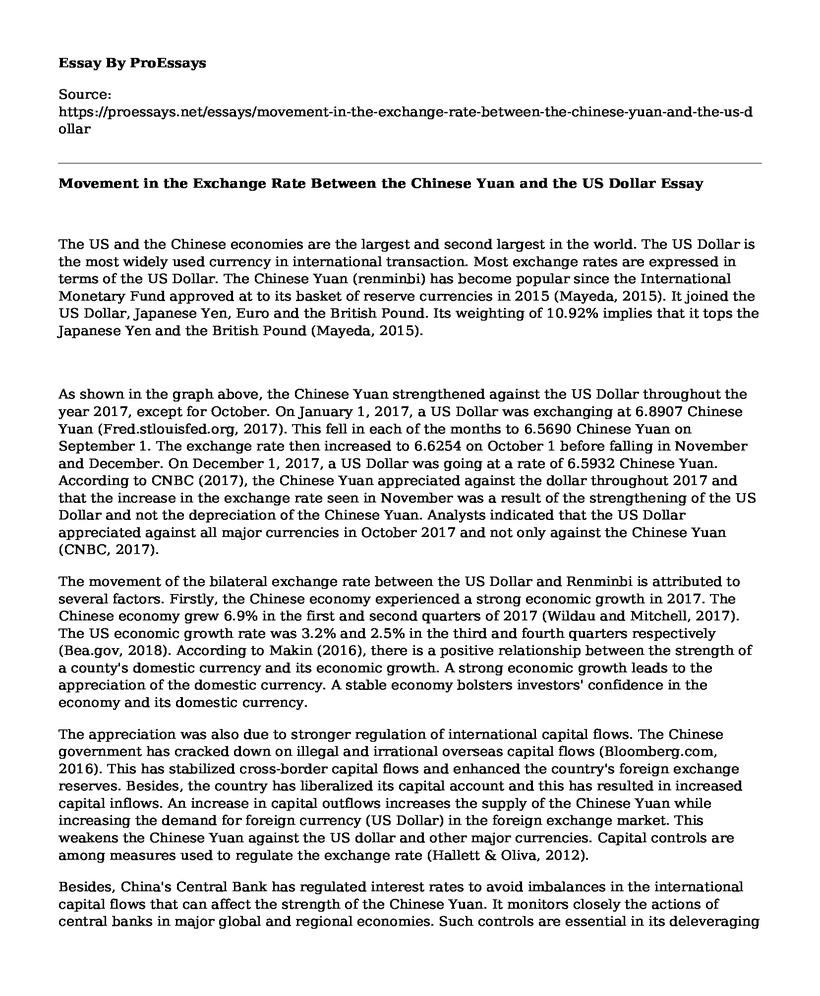
As shown in the graph above, the Chinese Yuan strengthened against the US Dollar throughout the year 2017, except for October. On January 1, 2017, a US Dollar was exchanging at 6.8907 Chinese Yuan (Fred.stlouisfed.org, 2017). This fell in each of the months to 6.5690 Chinese Yuan on September 1. The exchange rate then increased to 6.6254 on October 1 before falling in November and December. On December 1, 2017, a US Dollar was going at a rate of 6.5932 Chinese Yuan. According to CNBC (2017), the Chinese Yuan appreciated against the dollar throughout 2017 and that the increase in the exchange rate seen in November was a result of the strengthening of the US Dollar and not the depreciation of the Chinese Yuan. Analysts indicated that the US Dollar appreciated against all major currencies in October 2017 and not only against the Chinese Yuan (CNBC, 2017).
The movement of the bilateral exchange rate between the US Dollar and Renminbi is attributed to several factors. Firstly, the Chinese economy experienced a strong economic growth in 2017. The Chinese economy grew 6.9% in the first and second quarters of 2017 (Wildau and Mitchell, 2017). The US economic growth rate was 3.2% and 2.5% in the third and fourth quarters respectively (Bea.gov, 2018). According to Makin (2016), there is a positive relationship between the strength of a county's domestic currency and its economic growth. A strong economic growth leads to the appreciation of the domestic currency. A stable economy bolsters investors' confidence in the economy and its domestic currency.
The appreciation was also due to stronger regulation of international capital flows. The Chinese government has cracked down on illegal and irrational overseas capital flows (Bloomberg.com, 2016). This has stabilized cross-border capital flows and enhanced the country's foreign exchange reserves. Besides, the country has liberalized its capital account and this has resulted in increased capital inflows. An increase in capital outflows increases the supply of the Chinese Yuan while increasing the demand for foreign currency (US Dollar) in the foreign exchange market. This weakens the Chinese Yuan against the US dollar and other major currencies. Capital controls are among measures used to regulate the exchange rate (Hallett & Oliva, 2012).
Besides, China's Central Bank has regulated interest rates to avoid imbalances in the international capital flows that can affect the strength of the Chinese Yuan. It monitors closely the actions of central banks in major global and regional economies. Such controls are essential in its deleveraging campaign. In December 2017, the People's Bank of China raised the short-term interest rates following a hike of the federal funds rate by the US Federal Reserve (Ruwitch & Zhou, 2017). The interest rates also increased due to the bank's open market operations. Interest rate differences affect the exchange rate (Madura, 2016). If the interest rate in the US is higher than in China, there will capital outflows from China into the US economy. Capital outflows in China would lower the demand for the Chinese Yuan and increase the demand for the US Dollar (Hallett and Oliva, 2012). This would lead to the appreciation of the US dollar against the Chinese Renminbi. Therefore, interest rate controls, among other regulation, helped the Chinese Yuan to strengthen against the US dollar in 2017.
Theories of Exchange Rate Determination: International Parity Conditions
Exchange rates can be predicted or determined using the international parity conditions. International parity conditions relate the exchange rate to price levels and interest rates.
The Law of One Price - Purchasing Power Parity Theory
This theory states that in the absence of trade tariffs and transportation costs, the price of a commodity sold in two countries should be similar (Rogoff, 1996). Thus, the price difference should be the actual exchange rate used to convert the prices in both countries into a common currency. If the law of one price holds, then comparing the prices of a product in two countries simply involves converting one currency into another. The absolute version of this theory provides that the ratio of the two prices gives the real exchange rate for the two countries. Thus, the exchange rate between the Chinese Yuan and the US Dollar would be determined as follows:
Real Exchange rate = Price of the commodity in China Price of the commodity in the US
The absolute version of the law of one price has been proved to be ineffective in determining the spot exchange rate. It only shows whether one currency is correctly priced, overvalued or undervalued. The relative approach states that the law should be applied in determining the change in exchange rates from an equilibrium rate. Thus, if the RMB/USD exchange rate is in equilibrium, the changes in the prices of a commodity in both countries should reflect the relative variation in the exchange rate.
The Big Mac Index helps in comparing McDonalds' prices in international markets. The index is determined for each country and is used to determine the implied exchange rate based on the purchasing power parity theory.
| Month | China index (Yuan) | US Index (US Dollars) | Implied Exchange Rate | Actual Exchange Rate | % | Over/undervaluation |
| January 2016 | 17.60 | 4.93 | 3.57 | 6.56 | 45.6% | undervalued |
| July 2016 | 18.60 | 5.04 | 3.69 | 6.68 | 44.8% | undervalued |
| January 2017 | 19.60 | 5.06 | 3.87 | 6.93 | 44% | undervalued |
| July 2017 | 19.80 | 5.29 | 3.74 | 6.79 | 44.9% | undervalued |
Source: (The Economist, 2018)
The July index for China was 19.80 Yuan while that of the USA was $5.29. Thus, the implied exchange rate for the two currencies is 3.74 Chinese Yuan per US Dollar. However, the actual exchange rate was 6.79 implying that the Chinese Yuan was undervalued by 45%. Thus, the actual exchange rate showed a weaker Chinese Yuan than the real strength of the currency. If the conditions for purchasing power parity were true, then the US Dollar and the renminbi would exchange at 3.74.
The relative purchasing power parity approach argues that if the spot exchange rate between the Yuan and the dollar started in equilibrium, then any differential in the inflation rate between the US and China is offset by a similar change in the exchange rate (Madura, 2016). From the above table, the Chinese index increased by 1.02% (from 19.60 to 19.80) between January and July 2017. In the same period, the US Big Mac index increased by 4.55% (from $5.06 to $5.29). This implies that the inflation differential between the countries was 3.53% (4.55% - 1.20%). If the relating PPP holds, the exchange rate should fall by 3.53% (the Yuan should appreciate by 3.53%) to offset the inflation differential. The actual exchange rate data indicates that the Yuan appreciated by 2% against the dollar between January and July 2017. This is less than the required 3.53%. However, the appreciation of the implied rate was during the period was 3.35%, which is closer to 3.53%.
The above analysis shows that the purchasing power parity theory was not effective in forecasting the exchange rate between the US Dollar and the Chinese Yuan. In each of the months studied, the real exchange rate was significantly different form the implied exchange rate.
Reasons Why Purchasing Power Parity Was not Effective in Forecasting the Exchange Rate
The PPP was not effective in forecasting the exchange rate since there are trade tariffs. Both China and the US impose tariffs on imports to protect their domestic businesses and sectors as well as to raise revenue. Although China reduced some of its tariffs as a precondition to join the WTO, none of the countries are tariff-free. The existence of tariffs limits the applicability if the PPP theory in forecasting exchange rates. According to Levi (2016), the theory applies when both countries involved in international trade do not impose any import tariffs.
Besides, the theory applies only when there is a complete pass-through. This implies that traders must change the prices of imports and exports to reflect changes in the exchange rate. Thus, if the US dollar strengthens against the Yuan, then the price of a US product selling in China should be increased. However, this is not always the case. Firms use several mechanisms to avoid price changes resulting from fluctuations in the exchange rate. Competition between firms in the international market makes it difficult for firms to increase prices. Therefore, changes in prices of commodities are not reflective of the changes in the exchange rate. The theory also assumes that there is no transport cost between the US and China. This is hypothetical since all traders incur transport costs. The price of a US commodity sold in China includes the cost of production plus the transport and other logistics costs. Even if a US company produces the same goods in China, the prices vary due to the structural differences between the countries. The structural differences imply that such goods cannot be perfect substitutes even if they are produced by the same company.
According to Madura (2016), the PPP is effective over the long-run and not in the short-run. The forecasting period used in this case is one year (2016 to 2017). This is relatively a short period hence the forecast was not accurate. It also works best where two countries involved experience high inflation rates and have underdeveloped capital markets (Madura, 2016). Inflation rates in China was below 2% throughout 2017 while that of the US was just over 2%. Besides, the capital markets of both countries are not underdeveloped.
The approach was also ineffective since it ignores capital transactions. By focusing on the prices of commodities, the theory leaves out a significant factor influencing the demand and supply of currencies. A capital inflow increases the supply a foreign currency as well as the demand for the local currency. Most countries that regulate exchange rates focus more on capital controls. For instance, interest rate controls through the open market operations and other measures, have a significant effect on the capital account of the balance of payments.
The relative purchasing power parity approach is also not effective since it is difficult to determine the equilibrium exchange rate or to choose an appropriate base. The January 2017 rate cannot be said to the equilibrium rate. The equilibrium rate is attainable when the demand and supply of foreign currencies freely interact. Both countries undertake measures to control exchange rates hence the market rates do not accurately reflect the equilibrium values. China, for instance, China operates a managed floating exchange rate. The Peoples' Bank of China determines the midpoint fix daily and allows the exchange rate to fluctuate by only 2% from the daily fix. The midpoint fix is not a true reflection of the equilibrium rate and is regularly adjusted to regulate capital flows. This makes forecasting difficult since the rates...
Cite this page
Movement in the Exchange Rate Between the Chinese Yuan and the US Dollar. (2022, Apr 04). Retrieved from https://proessays.net/essays/movement-in-the-exchange-rate-between-the-chinese-yuan-and-the-us-dollar

so we do not vouch for their quality

If you are the original author of this essay and no longer wish to have it published on the ProEssays website, please click below to request its removal:
- The Impacts of Managing Financial Related Risks on the Financial Performance of the Banking Industry in the Netherlands
- Essay Sample on Differences Between the ADB, WB and IMF
- Unemployment and Inflation Rate in the UK Essay
- The Advantages of Secondment Program and Why It Is Essential for the United Arab Emirates
- Essay on Money Laundering: Destructive Risk to State, Banks and Community
- Essay Example on Agriculture: Key to Turkey's Food Security and Economic Stability
- Paper Example on Exploring Project Valuation Methods in Capital Budgeting: Advantages and Drawbacks


