Introduction
Any change in demand regarding volumes, product mix or product cycles is challenging to decision-makers at all levels (Joakim & Petri, 2016). Due to the increasingly high competitive pressures and progressive declines in profits, a more formal forecasting procedure has been introduced in the firm by the management to improve inventory management and production planning. It will play a key role in solving the uneven demand and the overstocking of some items at the expense of others.

Historical Trends Experienced for the Two Products
Based on the company data of the two products, it goes beyond any reasonable doubt that the two products account for a larger share of the company's profit. However, the demand for Product 1 displays an increasing trend over the last fourteen weeks. The highest has been in the fourteenth week at 96 units, with the lowest in the first week, at 50 units. Consecutively, the demand for Product 2 has been inconsistent, with increases in some instances, while also decreasing on others. The highest demand is realized in week 8, which stands at 47 units, whereas the lowest demand realized in the second week, which is 38 units. Due to the constant increase in demand for Product 1, it is therefore easy to predict that the demand for this product will definitely increase in the future and this will be important to future growth plans of the company.
Weekly Forecasts for the Next Four Weeks for Both Products
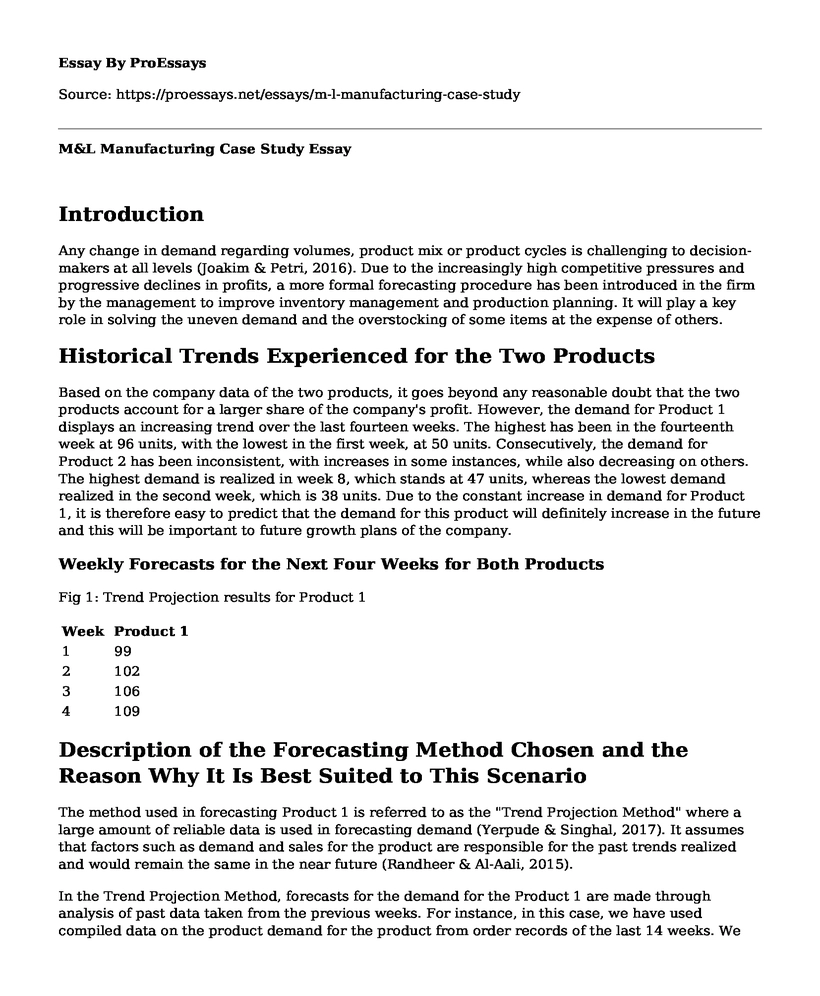
Fig 1: Trend Projection results for Product 1
| Week | Product 1 |
| 1 | 99 |
| 2 | 102 |
| 3 | 106 |
| 4 | 109 |
Description of the Forecasting Method Chosen and the Reason Why It Is Best Suited to This Scenario
The method used in forecasting Product 1 is referred to as the "Trend Projection Method" where a large amount of reliable data is used in forecasting demand (Yerpude & Singhal, 2017). It assumes that factors such as demand and sales for the product are responsible for the past trends realized and would remain the same in the near future (Randheer & Al-Aali, 2015).
In the Trend Projection Method, forecasts for the demand for the Product 1 are made through analysis of past data taken from the previous weeks. For instance, in this case, we have used compiled data on the product demand for the product from order records of the last 14 weeks. We have seen that its demand has been on an increasing trend over weeks. Hence, it is easy to predict that with other factors held constant, the demand for Product 1 will increase in the next four weeks by margins between three and four as has been in the case for the last 14 weeks. Plotting the data for Product 1 reveals a linear pattern except for demand in week 7. Demand in the week 7 is unusually high and does not fit on the line of best fit. Hence, considered as an outliner. The line of best fit can easily predict the next four weeks as 99,102,106 and 109.
Fig 2: Trend Projection results for Product 2
| Week | Product 2 |
| 1 | 43.33 |
| 2 | 50.50 |
| 3 | 44.50 |
| 4 | 44.50 |
Plotting the data for Product 2 yields a more complex pattern. It displays a spike once in every four weeks whereas the values between the spikes are close to each other. Furthermore, the data appear to increase at a rate of about a unit per week. An intuitive approach would, therefore, use the average of the nonspike periods plus 1 unit in predicting the coming three nonspike periods. Hence, using this approach, the forecast for the 16th week will be 43.33, the 16th week will be 50.50, the 17th week will be 44.50, and last week the forecast will remain at 44.50
The Reason for the Different Forecasting Approaches for the Two Products
Firstly, Trend projection method has been used in predicting the demand for Product 1 whereas Intuitive approach was used in the determination of demand for Product 2. It is because the demand for product 1 follows the same pattern for the last fourteen weeks as it has been on the same increasing trend. It, therefore, makes it easy to predict the future demand based on the results from the previous weeks.
On the other hand, the demand for Product 2 has been irregular and inconsistent, with particular instances increasing in some weeks, and decreasing in others. It is therefore essential to understand the current shape of the demand curve before coming up with future demand patterns (Joakim & Petri, 2016)
Benefits of Using a Formalized Approach to Forecasting the Two Products
The potential advantage of employing a formalized approach to forecasting is that it will be easier to use the computer and quantify the information (Carbonneau et al., 2016). A less formalized approach is more likely to utilize personal intuition. According to Makridakis, Wheelwright and Hyndman (2008), for small forecasting problems, intuition may include personal bias that may end up being reflected in the forecast. The forecasting problem may get bigger, and thus making it impossible to rely solely on a less formalized approach because a person's intuition may make it impossible to process a large quantity of information (Scott & Garner, 2014).
References
Carbonneau, R., Laframboise, K., & Vahidov, R. (2016). Application of learning techniques for supply chain demand forecasting. European Journal of Operational Research, 184(3), 1140-1154.
Joakim Coker, Petri Helo, (2016) "Demand-supply balancing in manufacturing operations", Benchmarking: An International Journal, Vol. 23 Issue: 3, pp.564-583, https://doi.org/10.1108/BIJ-04-2014-0028
Makridakis, S., Wheelwright, S. C., & Hyndman, R. J. (2008). Forecasting methods and applications. John wiley & sons.
Randheer, K., & Al-Aali, A. (2015). What, Who, How and Where: Retailing Industry in Saudi Arabia. Journal of Competitiveness Studies, 23(3), 54.
Scott, G., & Garner, R. (2014). Doing qualitative research: designs, methods, and techniques. Upper Saddle River: Pearson.
Yerpude, S., & Singhal, T. K. (2017). Impact of Internet of Things (IoT) Data on Demand Forecasting. Indian Journal of Science and Technology, 10(15).
Cite this page
M&L Manufacturing Case Study. (2022, Aug 15). Retrieved from https://proessays.net/essays/m-l-manufacturing-case-study

so we do not vouch for their quality

If you are the original author of this essay and no longer wish to have it published on the ProEssays website, please click below to request its removal:
- The Use of Equal Opportunity or Employment Diversity in Walmart Inc - Paper Example
- Essay Sample on Strategic Management Comparison Between Walmart and Nordstrom Company
- Apple's Strategic Model for Value Creation: Solving Problems for Customers - Research Paper
- Evaluation Essay on Apple Inc: Mission & Vision for Global Success
- Apple: A Symbol of Sophistication, Elegance, and Glamour - Essay Sample
- Walmart Labor Dispute: Conflict Management for Positive Change - Research Paper
- Essay Sample on Microsoft: Leadership & Management for Optimal Benefit


